All posts in data visualization
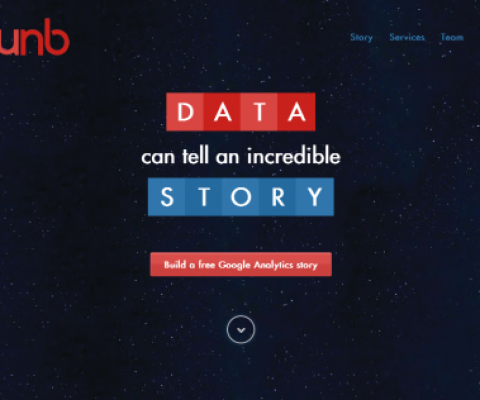
The latest qunb layout makes visualizing your Google Analytics data super easy
This week, data visualization startup qunb announced a new layout of its service, which once claimed to be the Youtube of data. Today, the service, which just recently finished the 3-month Techstars Boston program (SEE: 5 Things I learned at TechStars by qunb CEO Cyrille Vincey), now offers a very useful demo of their visualizatiion capabilities, […]

